23.1 Bar chart
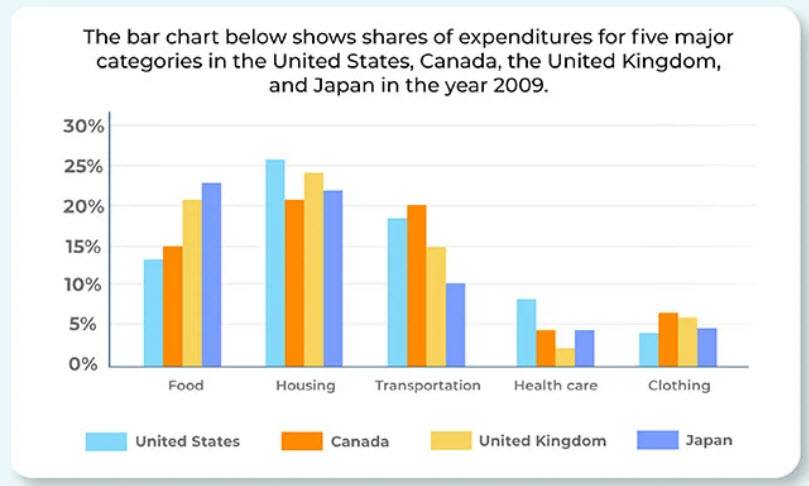
The bar char compares the ratio of spending by United States, Canada, the United Kingdom and Japan on five sectors (food, housing, transportation, health care and clothing) in 2009.
Overall, housing was the higest ratio of money was spent on housing in all countries except for Canada where transportation also held the same position and for Japan it was Food. Health care was at the lowest position for all nations except for United States.
Expenditure on food was least by United States that was around 13%, this figure increased marginally for Canada where it was close to 15%. United Kingdom spent nearly one fifth of total spending on food which was about 2% less than Japan's share. Spending on housing was almost same for all nations with nearly 25% by Unisted states which was five percent more than of Canada's and Japan's spending.
Canada spent hightes ratio, about 20%, in term of transportation by any country which was almost double that of Japan's figure in same sector. All countries spent less than 5% on health care with excaption of United States which utilized close to 8%. The least amoutn of money spent collectively by all countries was on clothing.
-=-=-=-=-=-=-=-=-=-
higest = highest
Unisted = United
hightes = highest
excaption = exception
amoutn = amount
Comments
Post a Comment