21.2 Bar graph
The chart below shows waste collection by a recycling center from 2011 to 2015. Summarise the information by selecting and reporting the main features and make comparisons where relevant.
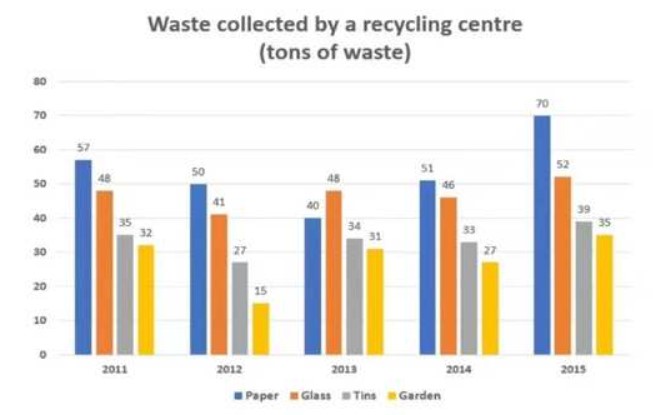
The bar chart compares the amount of four types of waste collected, namely paper, glass, tin and garden, by a recycling plant in five different years from 2011 to 2015. The unit of measurement is tons.
Overall, all soruces of waste displayed an overall increase at the end after showing fluctuation thorught the time period. Paper was the highest highest contributor each year except 2013 when glass took the first place, whereas garden constantly stayed at the bottom of the list each year.
Paper started at around 57 tons in year 2011 follwed by a continuous drop in next years before starting to rise again in year 2014 to finally end at almost 70 million in year 2015, which is the higest number reached by any contributor in any given year. Starting point for glass was just below 50 tonns in year 2011, it fluctuated for the next new years before eventually ending at just above 50 tonns in 2015.
Tin (35) and (32) garden strated at nearly equal position. Both experienced drop in the coming year, however, decline was more sudden for garden when it was at 15 tons, lowest for anyone in any given year, in 2012. Oscillations are observed in the behaviour of both in the coming years to finally tin and garden ending at 39 and 35 respectively.
-=--=-=
soruces = sources
thorught = throughout
follwed = followed
higest = highest
strated = started
Comments
Post a Comment